The bulk of my math-brain today was focused on finishing a write-up of an analysis of Minneapolis-St. Paul daily temperatures. It’s a nice time series that I found at the University of Dayton’s temperature archive, conveniently available as a csv file. Minnesota temperatures look like this:
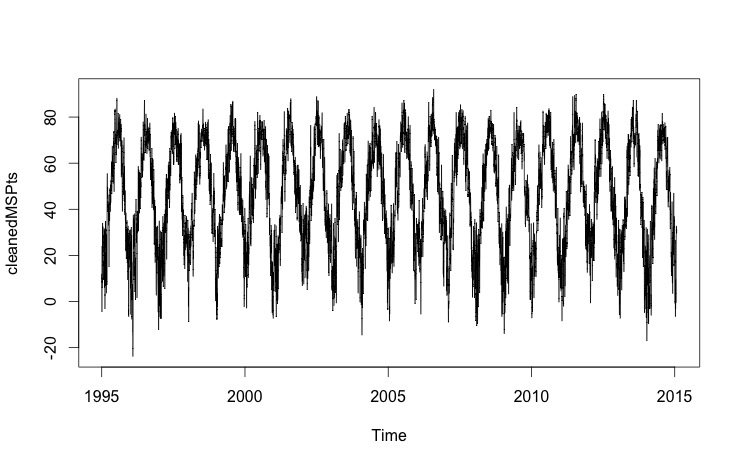
Daily temperatures at MSP
Mildly sinusoidal. Turns out there’s not much linear trend over this time period, even though in many cities there has been a significant warming trend over the last 15-20 years. (I wonder if this needs more analysis for MSP — I just did some basic trend analysis.) And remarkably, you can do a pretty good Fourier series fit for this data!
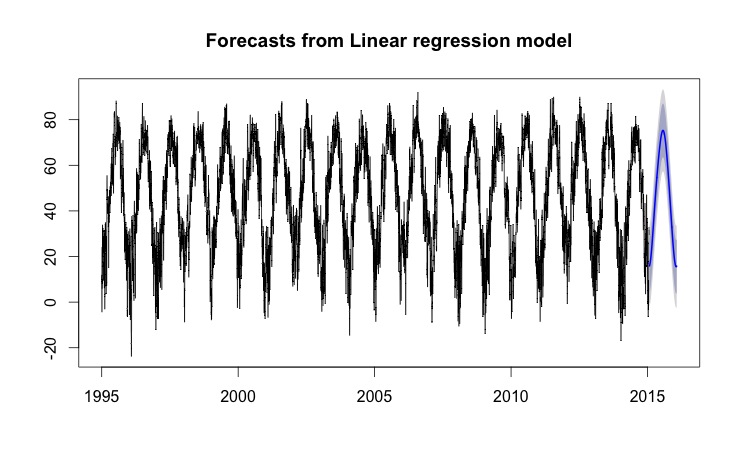
Data with Fourier series forecast at the end
The blue part at the end is a forecast of temperatures from the Fourier series I fit (using the “forecast” package in R).
Obviously the temperature data is much fuzzier than the Fourier series: what’s the noise? We can look at what the noise looks like by plotting the residuals:
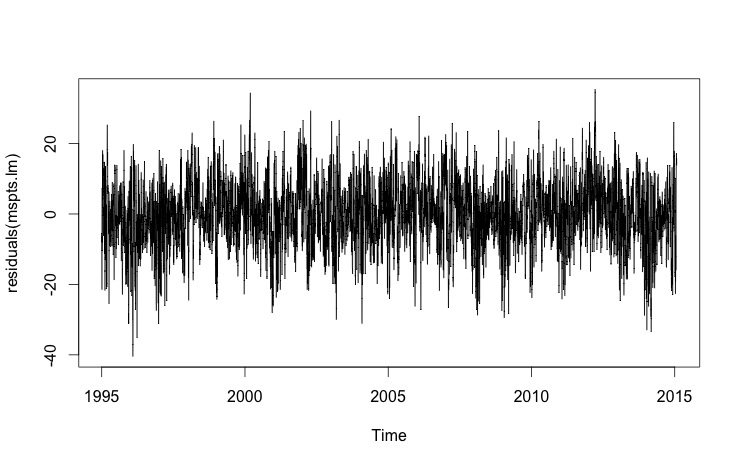
Hm. Looks like sometimes our weather is much colder than predicted — what a surprise. How much? Let’s look at a density plot of those residuals:
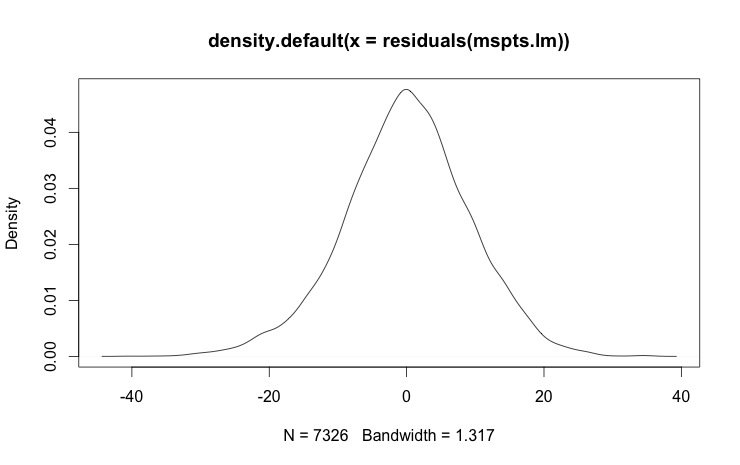
Density plot of residuals
Dang — that almost looks normal! And hence the title.
Of course it’s not quite normal: this is the land of Lake Wobegon. If all the children are above average, it’s because
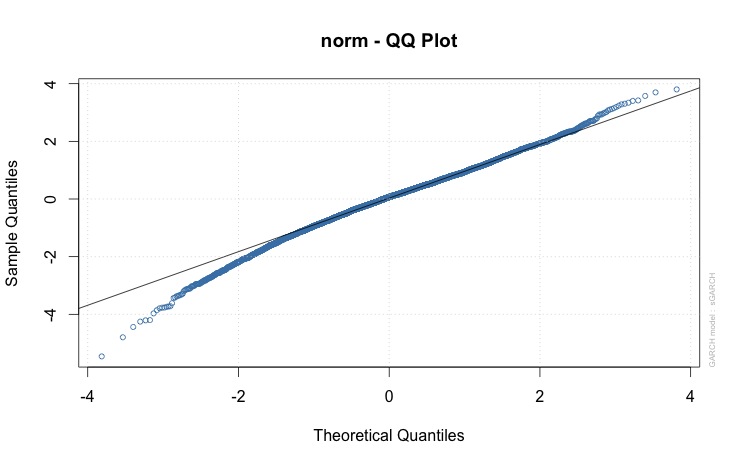
QQ plot of standardized residuals from rugarch
we’re close to normal, but a little bit skewed…. (Read about QQ plots at Wikipedia or NIST.)
One thought on “Minnesota’s weather is “normal””