Today I finally checked out the R package TDAmapper. I found very few tutorials for it, so here’s a bit of discussion
Curiously, there’s a lot more discussion of the math out there than the implementation. I just found Chad Topaz’s “Self-Help Homology Tutorial for the Simple(x)-minded” at his website, and there’s a more technical intro by Elizabeth Munch, and you can look up Ayasdi videos on YouTube for plenty more options — Ayasdi is the company started by Stanford math prof Gunnar Carlsson and others to try to use this mathematics for commercial purposes.
I’m going to just start with the examples in the TDAmapper documentation, though, as I understand the math reasonably well but have tons of questions about implementation that aren’t extensively discussed. Let’s get started!
mapper1D
Quoting from the documentation,
mapper1D(distance_matrix = dist(data.frame(x = 2 * cos(0.5 * (1:100)), y = sin(1:100))), filter_values = 2 * cos(0.5 * (1:100)), num_intervals = 10,
percent_overlap = 50, num_bins_when_clustering = 10)
What’s going on here?
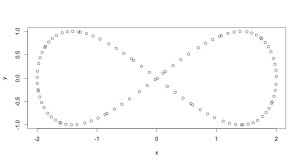
We’ve got data, which here is this cute artificial set in the shape of a infinity symbol:
plot(data.frame(x=2*cos(0.5*(1:100)), y=sin(1:100)))

gives an illustration.
Continue reading →
