This evening I did a quick Python examination of historical temperatures in Minneapolis/St Paul. We’ve been having some very warm days this November, and I was wondering how far from the norm they are. So I got data from 1970 until yesterday (didn’t go further because I had some trouble with the API) and
- figured out how to read it correctly as a time series in Python using pandas
- figured out how to select data using a nice selector technique
- and then plotted pictures & figured out stats.
There were some quirks to the date-time format that meant I had to look carefully at the options for read_csv, learning about the parse_date option and making sure my header and index_col options were also right. Then because I wanted to pick only November 8 temperatures from the last 45 years I needed to use a different type of data slicing than I’m most used to: I made a date range d and then picked out (d.month == 11) & (8 == d.day). That was a very neat solution — thanks, stackoverflow people! This resulted in the following distribution:
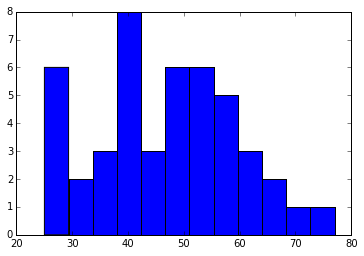
That’s just max temperatures on November 8 since 1970 binned into 12 bins. 12 bins looks nice. It looks so “normal”!
To sum things up, the average temp on November 8 is 46.46 degrees, and the standard deviation is 12.8 degrees. Yesterday’s high of 59 or 60 degrees (depends what source you look at) is a standard deviation above average!
Nothing groundbreaking, but a good exercise. Maybe a fun thing to do with a class at school — but getting the data into a nice format is non-trivial for your average teacher. What to do about that? Hmph.
One thought on “Mild adventures in Python”